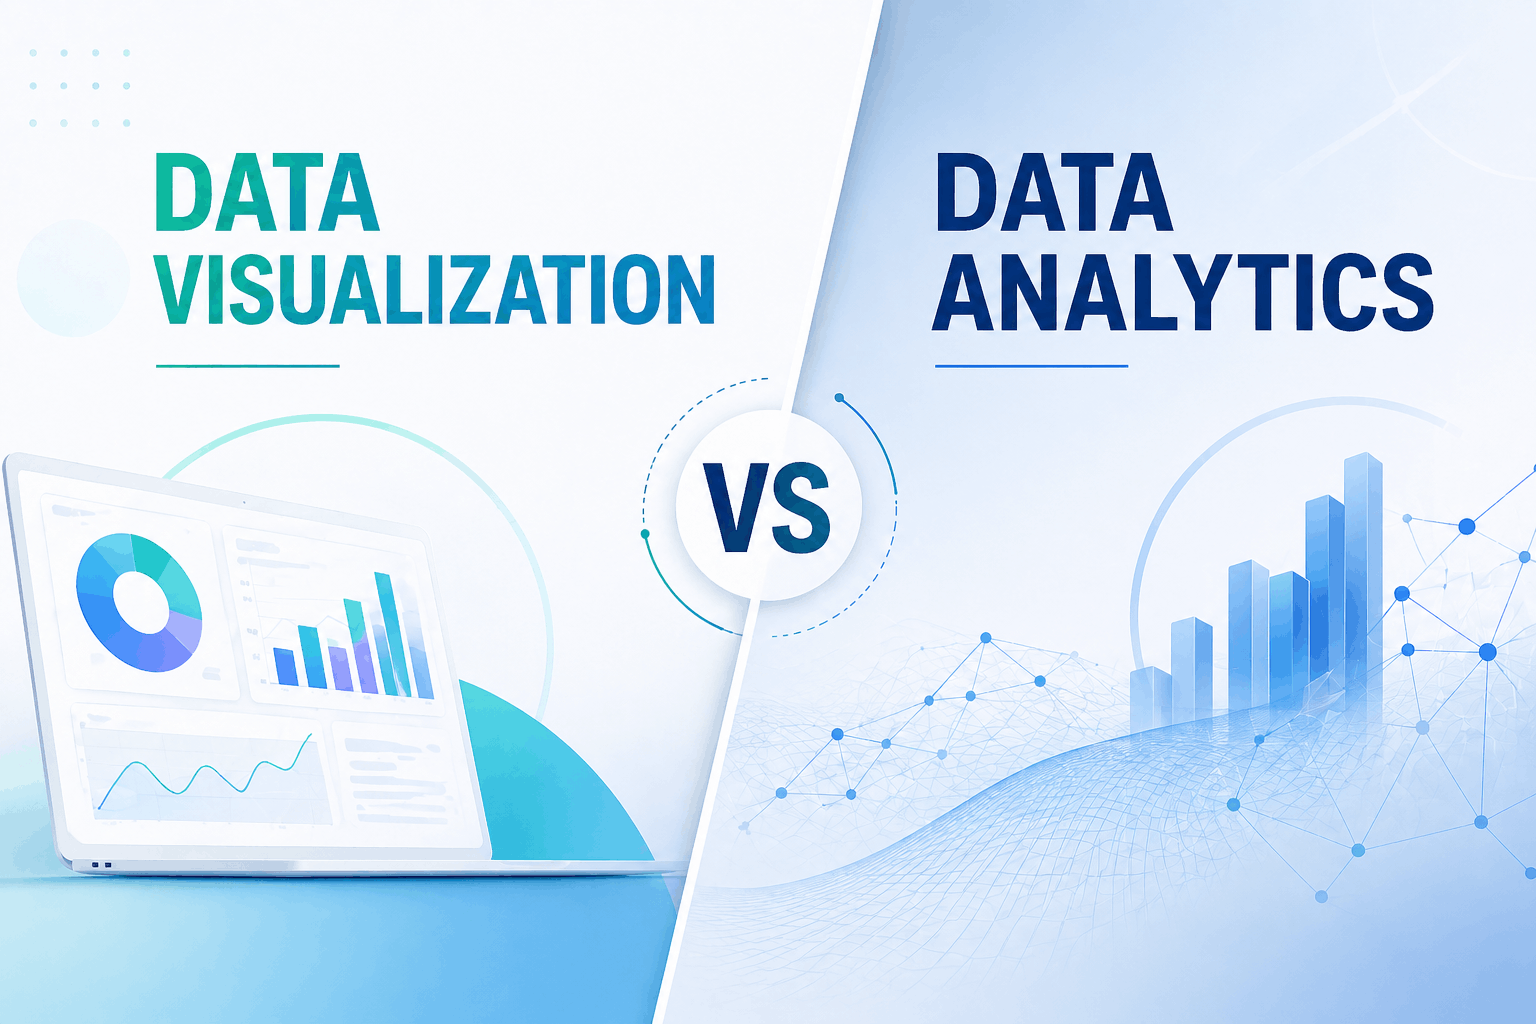


Modern enterprises often handle a multitude of data to run their daily operations. From outreach and development initiatives to customer service, data plays a crucial role. To engage, understand, and virtualize the raw and unstructured datasets, enterprises invest in Data Visualization and Data Analytics tools.
By playing a similar role in an enterprise, Data Analytics and Data Visualization bring clarity, understanding, and valuable insight for growth. As effective as they sound, let's see what they are, their types, and how they benefit enterprise operations, all in the following blog post.
What is Data Analytics
Data Analytics is the comprehensive process of gathering datasets and structuring and analyzing them for clarity. The process consists of data cleaning, transformation, and modeling using statistical and computational techniques. With enterprises failing to access valuable insights from data, Data Analytics gives the ability to access them all in an easy way.
By converting large volumes of structured and unstructured data into meaningful intelligence, it enables organizations to understand task performance, customer behavior, and market dynamics.
Example: Businesses can analyze customer journey or evaluate marketing strategies to improve product positioning and empower growth.
Types of Data Analytics
To improve the process, data analytics is segmented into 4 types. Here is some short information on what they are.
Descriptive Analytics
Descriptive focuses on old records of data to deliver a neat report on the past performance. This way, enterprises can summarize key metrics through reports and dashboards, helping teams to track progress and learn ongoing trends.
Diagnostic Analytics
This segment goes further to the root of the data to uncover the main causes behind every outcome. Upon analyzing relationships and correlations, diagnostics helps enterprises understand problems and operational issues.
Predictive Analytics
To learn the market trends and to forecast the enterprise performance through current reports, predictive analytics aid enterprises with a solid understanding. By learning the historical data and statistical models, predictive analytics estimates future outcomes. This way, enterprises forecast customer behavior, trend prediction, and risk assessment.
Prescriptive Analytics
For damage control and to make effective steps for growth, some enterprises go with prescriptive analytics. As an advanced form of analytics, prescriptive analytics offers actionable suggestions using predicted outcomes to fix issues or to improve performance. Powered by machine learning and AI, the module aids businesses in decision-making, modernization, and transition.
What is Data Visualization
Unlike Data Analytics, visualization is different. Designed to showcase data neatly, data visualization transforms complex datasets into graphical representations like charts, graphs, and dashboards. By transforming datasets into intuitive formats, it enables enterprises to easily interpret insights.
As important to generate insights from raw data, it is necessary to present it to teams to execute it. With many organizations, insights generated through analytics fail to create impact because they are not presented effectively. Thus, simplifying the way of going through dense spreadsheets, it provides visual dashboards to grasp key metrics, trends, and anomalies quickly. By offering flexibility in how data is harnessed, it also improves communication across departments by eliminating technical dependencies for stakeholders.
Types of Data Visualization
Similar to analytics, data visualization is categorized to cater to enterprises in different scenarios.
Comparative Visualization
As the name suggests, this is a module used to evaluate differences between categories, such as the revenue of any regions or departments. To simplify data representation, it uses common formats like bar charts and column charts.
Distribution Visualization
Distribution focuses on how your enterprise data is distributed across a range. Histograms, density plots, and box plots help organizations to find variations, anomalies, and inconsistencies in datasets. This enables teams with quality control, risk analysis, and customer segmentation data, delivering a clear understanding.
Trend Visualization
Trend visualization is a process that enterprises utilize to learn future trends and for time-sensitive operations. With the help of standard Line charts and time-series graphs, enterprises track revenue growth, demand fluctuations, and user engagement trends. This way, businesses forecast data for their long-term projects to achieve success and growth.
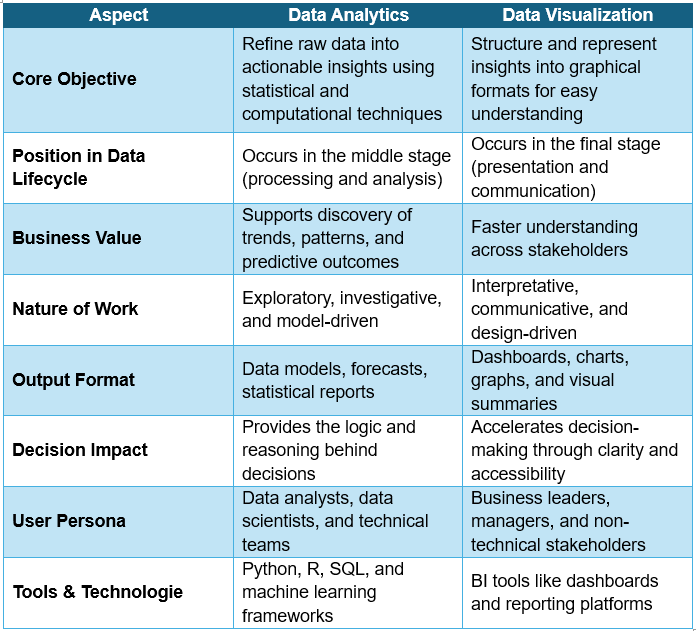
Difference Between Data Visualization and Data Analytics
Benefits of Data Analytics & Data Visualization
Faster Decision-Making
Enterprises can act quickly on time-specific and development tasks easily with gathered insights that are generated and presented in real time.
Improved Data Accuracy and Reliability
Data analytics make sure the data is pure, whereas visualization reduces misinterpretation through its clear representation.
Operational Support
Organizations can find irregularities, streamline processes, and simplify resource allocation effectively.
Better Stakeholder Communication
Visual dashboards make complex data accessible to non-technical teams to improve collaboration within teams.
Proactive Risk Management
Predictive analytics highlights potential risks, and visualization ensures they are easily understood and addressed.
Strategic Growth
From finding business opportunities, forecasting market trends, and more, analytics and visualization play for long-term growth.
Data Accessibility
Data becomes easier to consume across all levels of the organization, reducing dependency on specialized teams.
By offering multiple support and benefits to enterprises, Data Analytics and visualization work together to create an impact in enterprise operations. Upon answering the question of "Why", "what's next", and simplifying the interpretation of complex data of market prediction, they both aid teams with strategic operational needs.
Similar to the above, explore our range of insights over AI, Machine Learning, Platform services and more in our insights section.